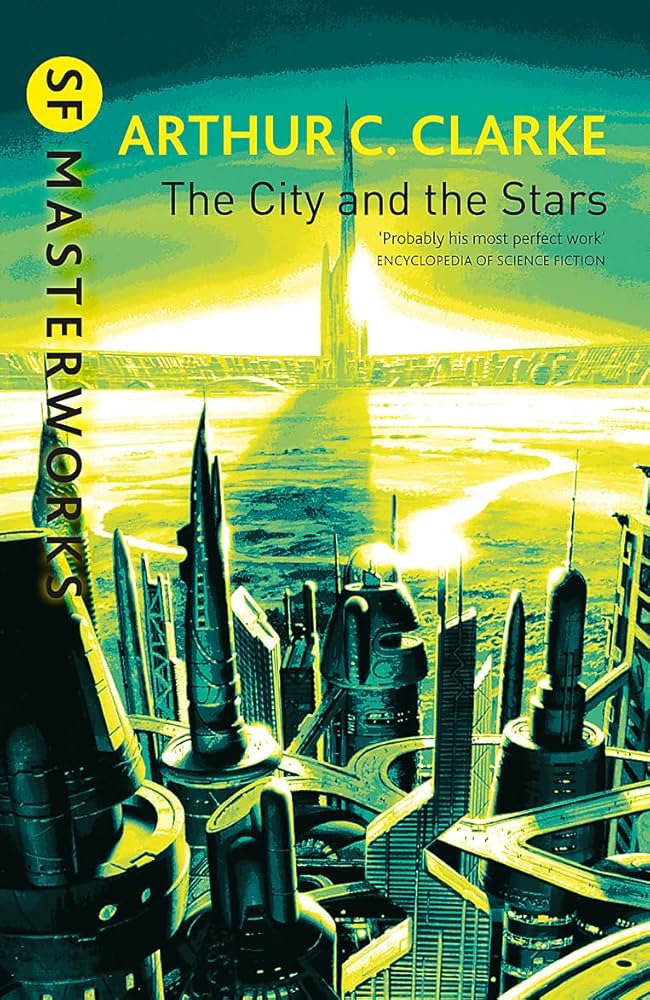
The City and the Stars (1956)

Summary
A young man escapes his futuristic utopian city to seek the truth about what happened to Earth.
My Thoughts
Clarke does a great job of building the lore around the city of Diaspar and describing how the inhabitants are created and interact. I tend to to prefer more character-driven stories like this one (which follows Alvin, a native of Diaspar who has certain special qualities). Alvin has questions about the origin of the city, its people, and what lies outside the impenetrable, sprawling desert that surrounds it. There's a great sense of mystery and discovery the reader gets to experience with Alvin. I think Clarke's creative side shone in this one. The latter part of the book is in sharp contrast to the 'realistic' (or at least loosely 'science-plausible') first act. Maybe a bit too fantastical for me. Still, this is probably a top 3 Clarke novel.
Map

The story describes Diaspar as a great city in a vast expanse of desert on a dead Earth. [Spoilers ahead] By the end of the book Alvin is able to harness the power of a superintelligent being and has plans to revitalize the planet back to its former glory. I imagine water would be one of the first things Alvin would attempt to import. This map shows what the Earth might look like after an initial very very large shipment of comets was brought to Earth and melted into a new ocean. I chose -4000 m depth since it created some interesting-looking new continents. Most of the new land area occurs at the mid-ocean ridges and the new continents are fairly flat and boring. On this new Earth Madagascar is now a part of mainland Africa and the Northern hemisphere is now basically a megacontinent.
Coding Notes
Data used in the maps come from PyGMT's built in earth relief dataset. This was my first time creating a custom colormap (solid tan for values above -4500 m and a blue gradient for values below). PyGMT can read these colormap ('.cpt') files which contain information about the colors to be used when displaying data. This script writes .cpt files to the folder where the script is and then reads from those .cpt files. Colormaps I've used in previous maps have all been built-in colormaps (of which there are many). Most map projections preserve one aspect of the real world (distances, areas, angles) to make them practically useful. This map uses the Robinson projection which actually doesn't preserve any particular aspect but was created to look aesthetically pleasing.