A Fall of Moondust (1981)
Summary
A group of moon tourists find themselves in a race against time after a freak accident during a voyage.
My Thoughts
I went on an Arthur Clarke binge in 2024 after reading Rendezvous with Rama in 2023. This one wasn't my favorite of his but it's solid. It takes place on the moon where the main plot involves a group of space tourists and two subplots center around people involved with a rescue team. I felt that one of the subplots weakened the story a bit and wish he'd spent more time focused on the trapped tourists and fleshed out their characters a bit more. There was also a romantic subplot that felt a bit tacked on, which I've noticed in some of his other novels.
Map
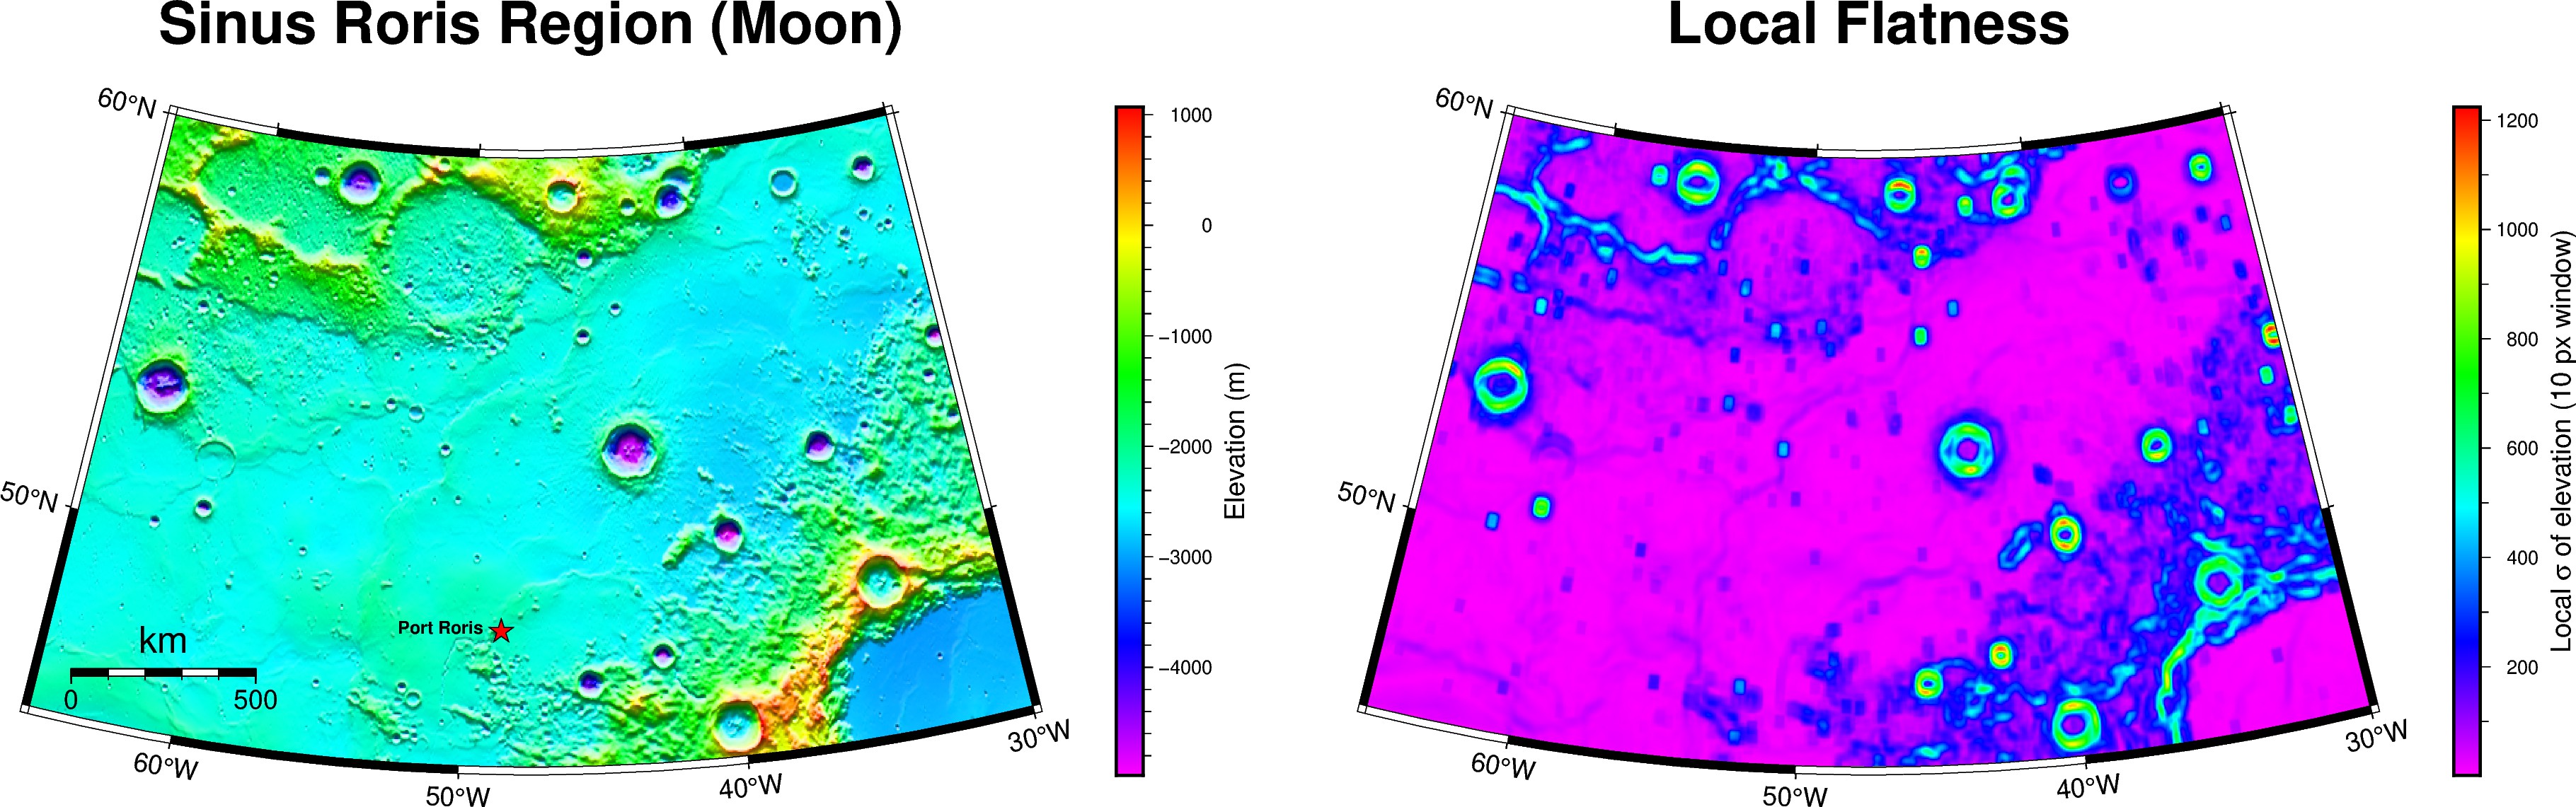
The tourists in the story start in a place called Port Roris and travel across what Clarke describes as a remarkably flat expanse of almost liquid-like dust. PyGMT actually has a built in function for downloading topographic Moon data (pygmt.datasets.load_moon_relief). The map on the left shows a simple shaded elevation map of the area of the moon that this book is allegedly based on (Sinus Roris), a large basaltic plain on the Moon's Northern Hemisphere. I also added a proposed location of the 'star port' in the book, Port Roris. The book doesn't specify exactly where it is but I put it on a solid rocky peninsula with good access to the flat dusty expanse. Youll notice that most of the elevation values on the Moon's surface are 'negative'. This is all relative to the datum used - on Earth the datum is based on sea level but since there's no water on the Moon they must use some other metric. The map on the right shows the 'flatness' of the same region, using a standard deviation function that inspects the elevation values of the surrounding pixels for each pixel. The lower the value, the 'flatter' the area. There's probably some other cool moon maps to make so I might have to read more moon books.
Coding Notes
Data used in the maps come from the moon relief database mentioned above. This was my first time using the 'grdgradient' function which gives elevation data a nice shaded look. To perform calculations on the elevation grid I had to convert it to a NumPy array 'moon_grid_array = moon_grid.values' and then back to an Xarray DataArray 'std_da = xr.DataArray' I'm not actually sure if it had to be converted to a NumPy array, there might be a way to do the standard deviation calcuations on the Xarray.